Triangles
6 minutes to read
We are given the following Python source files:
triangulate.py:
import csv
import math
import random
from secret import getFlagLocation

arr = []
with open('grid.csv') as grid:
    for x in csv.reader(grid):
        arr.append(x)
        pass

def getDistance(x,y,x2,y2):
    return math.sqrt(math.pow(x - x2,2) + math.pow(y - y2,2))

def cap(num):
    if num > 99:
        return 99
    if num < 0:
        return 0
    return num

def createCoords(x,y):
    x1 = random.randint(-7,7)
    y1 = random.randint(-7,7)
    x2 = random.randint(-7,7)
    y2 = random.randint(-7,7)
    x3 = random.randint(-7,7)
    y3 = random.randint(-7,7)

    p1 = [cap(x1 + x), cap(y1 + y)]
    p2 = [cap(x2 + x), cap(y2 + y)]
    p3 = [cap(x3 + x), cap(y3 + y)]

    val1 = arr[p1[0]][p1[1]]
    val2 = arr[p2[0]][p2[1]]
    val3 = arr[p3[0]][p3[1]]

    distances = [(val1,getDistance(x,y,p1[0], p1[1])),(val2,getDistance(x,y,p2[0], p2[1])),(val3,getDistance(x,y,p3[0], p3[1])),(f"{val1}{val2}",getDistance(p1[0], p1[1],p2[0], p2[1])),(f"{val2}{val3}",getDistance(p2[0], p2[1],p3[0], p3[1])),(f"{val1}{val3}",getDistance(p1[0], p1[1],p3[0], p3[1]))]
    return distances

def createTriangulation():
    with open("out1.csv",'w') as out:
        writer = csv.writer(out)
        for coord in getFlagLocation():
            for val, dist in createCoords(coord[0],coord[1]):
                writer.writerow([val,dist])

def main():
    createTriangulation()

if __name__ == "__main__":
    main()
secret.py:
import csv

f = "HTB{fake_flag_for_testing}"

arr = []
with open('grid.csv') as grid:
    for x in csv.reader(grid):
        arr.append(x)
        pass

flagLocation = list()
# Coordinates are all placeholder values
flagLocation.append([1,2]) # H
flagLocation.append([2,2]) # T
flagLocation.append([3,2]) # B
flagLocation.append([4,2]) # {
flagLocation.append([55,2]) # f
flagLocation.append([65,2]) # a
flagLocation.append([75,2]) # k
flagLocation.append([85,2]) # e
flagLocation.append([9,25]) # _
flagLocation.append([5,2]) # f
flagLocation.append([6,2]) # l
flagLocation.append([7,2]) # a
flagLocation.append([8,2]) # g
flagLocation.append([9,2]) # _
flagLocation.append([1,12]) # f
flagLocation.append([2,22]) # o
flagLocation.append([3,32]) # r
flagLocation.append([4,12]) # _
flagLocation.append([5,22]) # t
flagLocation.append([6,32]) # e
flagLocation.append([7,22]) # s
flagLocation.append([8,42]) # t
flagLocation.append([9,52]) # i
flagLocation.append([12,2]) # n
flagLocation.append([11,2]) # g
flagLocation.append([13,2]) # }

def getFlagLocation():
    return flagLocation

def checkFlag():
    for i in range(len(f)):
        if arr[flagLocation[i][0]][flagLocation[i][1]] != f[i]:
            print("error")
            pass
And we also have two CSV files:
grid.csv:
P,1,<,:,M,A,T,b,3,*,V,T,C,E,c,:,$,Y,&,#,P,Y,8,#,f,*,y,T,e,^,C,J,I,I,e,e,r,Y,X,o,z,W,v,1,L,v,",",E,Z,A,Q,9,q,D,I,K,g,.,o,R,V,%,%,2,8,G,w,",",C,l,",",o,:,9,Z,#,T,B,",",W,t,q,c,n,p,2,G,A,6,{,R,v,L,q,j,m,T,:,V,3
u,g,^,R,*,;,>,s,y,D,o,V,J,r,@,I,3,},J,m,2,I,n,C,1,X,?,(,3,Y,o,k,g,W,3,:,8,k,u,m,i,0,m,c,h,b,O,3,3,},Y,.,],X,y,a,{,T,.,",",e,O,<,r,X,V,6,X,P,B,$,v,6,;,V,B,],w,(,*,f,T,*,>,2,",",R,U,x,z,>,5,.,f,&,1,3,3,F,I

...

},k,D,!,",",c,v,%,q,u,k,s,k,0,>,e,3,m,n,E,V,;,9,(,3,3,H,>,t,Y,&,k,b,S,l,^,i,[,0,*,m,R,%,P,D,^,*,0,t,Y,$,D,8,h,D,n,L,4,h,E,X,7,7,[,!,j,N,!,y,&,n,Q,.,5,u,W,&,I,A,X,.,[,q,6,f,K,M,k,[,&,3,d,),],8,},E,8,x,a
out.csv:
[,6.4031242374328485
p,5.0
4,2.23606797749979
[p,8.0
p4,2.8284271247461903
[4,6.324555320336759
X,7.211102550927978
1,7.211102550927978
5,7.0710678118654755
X1,8.0
15,11.045361017187261
X5,14.212670403551895

...

>,5.0
x,3.605551275463989
;,7.810249675906654
>x,7.0710678118654755
x;,4.242640687119285
>;,10.198039027185569
Source code analysis
As can be seen, secret.py uses a initial 2D-grid (grid.csv) and associates flag characters to coordinates within the grid. The flag shown in the given secret.py is just a placeholder, to understand the purpose of the script.
The main function in triangulate.py calls createTriangulation:
def createTriangulation():
    with open("out1.csv",'w') as out:
        writer = csv.writer(out)
        for coord in getFlagLocation():
            for val, dist in createCoords(coord[0],coord[1]):
                writer.writerow([val,dist])

def main():
    createTriangulation()
As can be seen, for each coordinate that comes from getFlagLocation (from secret.py), some lines are written to out.csv. These lines come from createCoords:
def createCoords(x,y):
    x1 = random.randint(-7,7)
    y1 = random.randint(-7,7)
    x2 = random.randint(-7,7)
    y2 = random.randint(-7,7)
    x3 = random.randint(-7,7)
    y3 = random.randint(-7,7)

    p1 = [cap(x1 + x), cap(y1 + y)]
    p2 = [cap(x2 + x), cap(y2 + y)]
    p3 = [cap(x3 + x), cap(y3 + y)]

    val1 = arr[p1[0]][p1[1]]
    val2 = arr[p2[0]][p2[1]]
    val3 = arr[p3[0]][p3[1]]

    distances = [(val1,getDistance(x,y,p1[0], p1[1])),(val2,getDistance(x,y,p2[0], p2[1])),(val3,getDistance(x,y,p3[0], p3[1])),(f"{val1}{val2}",getDistance(p1[0], p1[1],p2[0], p2[1])),(f"{val2}{val3}",getDistance(p2[0], p2[1],p3[0], p3[1])),(f"{val1}{val3}",getDistance(p1[0], p1[1],p3[0], p3[1]))]
    return distances
In math terms, this function receives the coordinates of a flag character as
Note that cap only limits the upper and lower limit within the grid:
def cap(num):
    if num > 99:
        return 99
    if num < 0:
        return 0
    return num
Next, val1, val2 and val3 are the characters that appear at coordinates
The function returns 6 tuples:
val1andval2andval3andval1,val2andval2,val3andval1,val3and
Where
def getDistance(x,y,x2,y2):
    return math.sqrt(math.pow(x - x2,2) + math.pow(y - y2,2))
To sum up, for each flag character, we are given 6 lines in output. For instance, for the first character, we have:
[,6.4031242374328485
p,5.0
4,2.23606797749979
[p,8.0
p4,2.8284271247461903
[4,6.324555320336759
Solution
Let’s name some results:
Now, let’s draw an example:
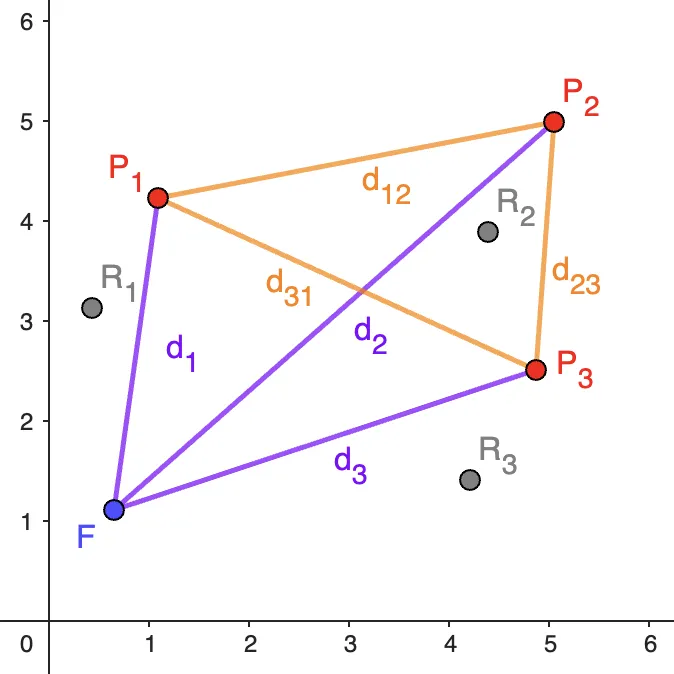
Using only the distances, we are not able to locate the coordinates of the point
In order to find suitable val1, val2 and val3, so we can take a few candidates for
Implementation
Let’s start wrinting the solution in a Python script. First of all, let’s read the CSV files and define the dictionary of values and coordinates that hold such values:
#!/usr/bin/env python3

import csv

from collections import defaultdict
from itertools import product


with open('grid.csv') as f_grid, open('out.csv') as f_out:
    grid = [row for row in csv.reader(f_grid)]
    results = f_out.read().splitlines()

values = defaultdict(list)

for x, row in enumerate(grid):
    for y, value in enumerate(row):
        values[value].append(x + 1j * y)
When dealing with 2D coordinates in Python (and Go), I like to use complex numbers, because it is easier to operate with them. For instance, the euclidean distance
Now, for every sequence of 6 lines in out.csv (results), we will take val1, val2, val3 and the distances
for i in range(0, len(results), 6):
    val1, d1 = results[i + 0][:1], float(results[i + 0][2:])
    val2, d2 = results[i + 1][:1], float(results[i + 1][2:])
    val3, d3 = results[i + 2][:1], float(results[i + 2][2:])

    d12 = float(results[i + 3][3:])
    d23 = float(results[i + 4][3:])
    d31 = float(results[i + 5][3:])
First of all, we find points val1, val2 and val3, and we find the one that has distances
    for P1, P2, P3 in product(values[val1], values[val2], values[val3]):
        if abs(P1 - P2) == d12 and abs(P2 - P3) == d23 and abs(P3 - P1) == d31:
            break
Once those points are found, we iterate through all points in the grid (itererating the dictionary) and print the value of the point
    for value, points in values.items():
        for F in points:
            if abs(F - P1) == d1 and abs(F - P2) == d2 and abs(F - P3) == d3:
                print(value, end='')
                break
Flag
If we run the script, we will get the flag:
$ python3 solve.py
HTB{sQU@r3s_R_4_N3rD$}
The full script can be found in here: solve.py.